Strategy Development for Increasing Sales and Marks and Spencer
| ✓ Paper Type: Free Assignment | ✓ Study Level: University / Undergraduate |
| ✓ Wordcount: 7816 words | ✓ Published: 06 Jun 2019 |
INTRODUCTION
In order to make good decisions in business, the use of information should be effective. In business decision making an insight is given into the various sources of data collection both primary and secondary that can be used. It also enables one to develop techniques that can be used in relation to the collecting of data, how to store it and the effective tools that is available to create and make your work presentable. Business decision making also encourages the use of different software packages like Microsoft word, Power Point and Excel to complete given tasks.
In this report I will be using different methods to analyse data and present results. Through this unit I have gained a lot of knowledge in ICT and have developed an appreciation for it. Information systems in this topic are used in organisations at all levels to help in decision making.
This has provided opportunities to develop different techniques into the gathering, storing and understanding of tools readily available to me for the creating and presenting of useful information to support business decision making/so business decisions can be made.
The aims and objectives of this report is provide an understanding of a variety of sources for collecting primary and secondary data, using a range of techniques to analyse data effectively for the purposes of businesses, producing information in different formats that are appropriate for decision making in context to organisations. For this report software generated information is also used for decision making in organisations and the factors impacting decision making in groups or individually.
Scenario
As part of the management team of Marks and Spencer, which is a High Street Retailer in the UK, you have been tasked by this reputable retailer, to assist them in making strategic decisions to improve upon their revenues for the food section of their business activities, where sales have fallen drastically. To achieve this role assigned to you, you have been asked to use the following tasks (1-4) to accomplish the making of strategic and tactical decisions for the entire organisation as a whole to overturn their misfortunes in the food section.
TASK 1: BE ABLE TO USE A VARIETY OF SOURCES FOR THE COLLECTION OF DATA, BOTH PRIMARY AND SECONDARY
- .Create a plan for the collection of primary and secondary data regarding how sales can be improved in the food sections of the business
A brief introduction on the importance of decision making for M&S food) to improve sales
M&S warned that all its planned changes to the business – from cutting prices to improving staffing levels – will impact on its profitability in the short term. Yet Rowe believes profitability should not be the focus now.
“Our priorities are the customer and brand and how we are going to recover clothing and home and continue to grow the food business. That involves improving our net promoter scores, evaluating reviews online and look at fit and quality online.” says Marks & Spencer boss Steve Rowe.
M&S is planning more IT investments as it looks to continue building on its website and will spend more improving the in-store experience by upgrading cafés or introducing new concepts such as coffee-to-go.
They will also reinstate staffing levels, admitting the brand has previously “cut back a little too far” in certain areas.
What aims and objectives of your research?
Create a plan for the collection of primary and secondary data regarding how sales can be improved in the food sections of Marks and Spencer.
To accomplish the making of strategic and tactical decisions for Marks and Spencer as a whole to overturn their misfortunes in the food section.
What is the Purpose of your research?
I made a report for Marks and Spencer, which is a High Street Retailer in the UK, recommended methods for the collection of data to improve upon their revenues for the food section of their business activities, where sales have fallen drastically.
What is primary and secondary research?
Primary data which is the information received directly from the source. It is data collected specifically for a particular purpose for example – information provided from questionnaires or one-to-one interviews.
Secondary data are ones that have already been collected by other people for example information available in journals, websites.
Explain how primary and secondary data’s can be collected for your purpose
Data collection is anything that conveys a meaning. This means that when data is coded it gives information and when used it gives knowledge.
Data can be collected in two ways:
Primary data sources occur when the expert himself or herself has gathered the information, not somebody else and it is also original information. This data can be quantitative or qualitative, and it could be expensive to collect. Primary data is collected by using diverse methods which are interview, survey or sampling, and monitoring their behavior.
The primary data research for this study will reveal customer’s preferences for home furniture.
Secondary data are data that have been collected somewhere else. Secondary data are crucial for the organisational research being the information gathered by somebody other than the specialist leading the present study. Examples of secondary data collection are census data, case studies, books, etc. This type of data is low-cost compared to primary data.
For this survey secondary data can be collected on the number of how many customers are in on a daily basis, number of staff, past sales records etc.
For my data collection I will be considering both quantitative information and qualitative data as this will enable me to collect numerical and descriptive data.
PLAN FOR
DATA COLLECTION
| Primary Data | Secondary Data |
| Examples of primary data I can use would be questionnaires, surveys, through the post or interviewing customers on a one-to-one basis. I will carry this out, outside the M&S in my local area, as this will enable me to collect information directly from the customers. I will aim to interview 30 people minimum all over the age of 18+. | This data will be collected through the use of journals, books, research reports and internal records of M&S, using information such as the feedback of customers, reports made by others through research, any possible complaints made by customers, loyalty store cards as it has/possess information about the customers. |
- Here, you will present the survey methodology and sampling frame used (Please be reflective in your explanation)
What are the survey and sample methods that you will be using to collect data?
Surveys are suitable to collect data on phenomena that cannot be perceived directly. In a survey, scientists sample a population. If the population is large researchers directly question only a sample (a small proportion of the population) to save time, price and other resources.
Surveys are a valued and instructive operational management tool which can be used to collect precise likes, dislikes and other data to help with key decisions. Communities use surveys to collect quantitative data for a diversity of purposes such as customer satisfaction, new service introduction, customer attitudes and perceptions, measuring pricing changes, and bundling services. In addition, several surveys can be conducted over a period of time to benchmark results, providing valuable trend data.
In statistics, a sampling frame is the source list from which a sample is drawn. It includes all those within a population who can be sampled, and may include individuals, households or institutions.
| Stages | Description |
Types of data for Office Furniture Ltd |
Primary data sources occur when the expert himself or herself has gathered the information, not somebody else and it is also original information. This data can be quantitative or qualitative, and it could be expensive to collect. Primary data is collected by using diverse methods which are interview, survey or sampling, and monitoring their behavior.The primary data research for this study will reveal customer’s preferences from which supermarket should buy their food.
Secondary data are data that have been collected somewhere else. Secondary data are crucial for the organisational research being the information gathered by somebody other than the specialist leading the present study. Examples of secondary data collection are census data, previous sales reports, marketing reports, etc. This type of data is low-cost compared to primary data. For this survey secondary data can be collected on the number of how many customers are in on a daily basis, number of staff, past sales records etc. |
Sources of secondary data |
Internal – These discuss to the sources of information within the organisation. Internal sources include transportation costs, salesmen’s reports, etc. For this research data on food sector in M&S supermarket, customer data can be sought from the POS, email systems, etc.External – is a linking to an external database. For food sector research M&S can purchase a database from a broker or gaining admission to a proprietary database. |
Methods for collecting primary dataSurveys are suitable to collect data on phenomena that cannot be perceived directly. In a survey, scientists sample a population. If the population is large researchers directly question only a sample (a small proportion of the population) to save time, price and other resources. Surveys are a valued and instructive operational management tool which can be used to collect precise likes, dislikes and other data to help with key decisions. Communities use surveys to collect quantitative data for a diversity of purposes such as customer satisfaction, new service introduction, customer attitudes and perceptions, measuring pricing changes, and bundling services. In addition, several surveys can be conducted over a period of time to benchmark results, providing valuable trend data. In statistics, a sampling frame is the source list from which a sample is drawn. It includes all those within a population who can be sampled, and may include individuals, households or institutions. Population is the all market segmentation that we need to get data from. Sample is a subset of market segmentation or a representation of a population to create the data required, sampling can be either probability or non-probability. Sampling that does not characterise the population will lead to a sampling error and the information gathered will not be representative. There are two key classes of sampling: probability and non-probability sampling. In probability sampling, all the population (e.g., persons, households) have some chance of being involved in the sampling. A probability sampling method is any manner of sampling that uses some form of random selection eg picking a name out of a hat, or use of computers to choose random numbers; these methods are unbiased. Simple random sampling method uses random selection from a bigger cluster of population. In this sampling technique each member of the subset has an equal chance of being chosen. Systematic sampling is related to random sampling but in this method the sampling is done at a fixed interval, as in every 5th and 10th customer that will buy from food section from M&S. In Cluster sampling the population is divided into groups or clusters. After that, a random sample of that cluster is chosen from the population. The survey will be conducted based on the information from the sampled clusters. Stratified random sampling is also named proportional or quota random sampling, involves dividing the population into homogeneous subgroups and then picking a simple random sample in every subgroup. This method assures that not only the whole population will be represented, but also significant subgroups of the population, especially small minority groups. By contrast, in non-probability sampling, samples from the population are selected on the basis of their availability (e.g. by volunteering) or it is done on researcher’s personal assumption that they are typical. The end result is that an indefinite share of the population is excluded. Non-probability sample is called a convenience sample – not due to the fact that samples are certainly easy to recruit, but because individuals that are used by the researcher are taken by their availability rather than selecting from the total population. The difference between non-probability and probability sampling is that non-probability sampling does not implicate random selection and probability sampling does. Non-probability samples cannot depend upon the foundation of probability method. A main characteristic of non-probability sampling method is that samples are selected based on the subjective judgment of the scientist. Before choosing a Sampling Method, many factors need to be taken into consideration: the allocated budget, how quickly the information is needed, if the population is homogenous or heterogeneous and how accessible the population is. In the given scenario we are asked to present a survey methodology to carry out the research how to improve upon their revenues for the food section in M&S, where sales have fallen drastically. As far as sampling is concerned, the database of the actual customers of M&S can be used. |
|
Plan for data collection |
Marks and Spencer has been recommended to carry on the Questionnaire survey because they can target large number of persons and contact respondents in extensively dispersed locations, for example post or internet.In this method a questionnaire is emailed to the database with a request to answer the questions. This is more appropriate to collect primary data for the purpose of starting buying from food section because it gives chance to discuss in debt thoughts as well as facts about why they are choosing M&S supermarket to do their shopping. |
Sampling methods |
In the research we recommend the simple random sampling method. In this probability sampling method the samples are gathered in a process that does give all the individuals in the population equal chances of being selected. |
Sampling Frame |
In the present case, M&S wants to know the perceptions and profile of people who buy from food section. For this research the sampling frame will be the customer list of M&S. 1,000 customers will be chosen at random from the entire customer database, which includes about 10,000 customers. |
Sample size |
The sample size for the study will be 1,000 customers selected at random from that database. |
Data storage |
Data collected will be stored in a secure place with a strict password protection. |
1.3 Design a questionnaire to collect the data relating to the reasons why sales have fallen and how revenues can be improved in the food department of Marks and Spencer.
Questionnaires are a popular means of collecting data, but are diverse to design and after they need many rewrites before an acceptable questionnaire is produced.
This questionnaire was designed to find out why sales have fallen and how revenues can be improved in the food department of Marks and Spencer.
QUESTIONNAIRE
Dear respondent
The purpose of this questionnaire is to collect data for the purpose of finding why you have chosen Marks and Spencer supermarket for your daily/weekly/monthly shopping. If you could kindly give some of your time to fill out the questionnaire by ticking the most relevant box it would be much appreciated. Your responses and answers will be strictly confidential.
- Under what age range do you fall? Please tick one of the following.
18-20 21-30 31-40 41-50 51-60 61+
- On average how much do you spend on a weekly, quarterly or monthly basis?
£0-£100 £101-£200 £201-£300 £301-£400 £401-£500 £501+
- How do you feel about the service provided at Marks and Spencer?
Very satisfied Satisfied Partly satisfied Not satisfied at all
- The discounts given by Marks and Spencer does it suit your needs?
Yes No
Explain______________________________________________________________________________________________________________________________________________
- Are the discounts useful towards the contribution of your daily, weekly or monthly shopping?
Yes No Explain_______________________________________________________________________________________________________________________________________________
- How long have you been shopping at Marks and Spencer and why?
___________________________________________________________________________
- How would you rate Marks and Spencer, in comparison to Asda, Sainsbury or Tesco? On a scale of 1 (worst) to 10 (better).
1 2 3 4 5 6 7 8 9 10
- Are you happy with the products provided by Marks and Spencer? On a scale of 1 (not happy) to 5 (very happy).
1 2 3 4 5
- Do you think it is good value for money?
Yes No
- Do you own a loyalty store card?
Yes No
- Do you like to buy your meat products at Marks and Spencer?
Yes No
- Do you feel that you get a better quality?
Yes No
Explain______________________________________________ ___________________________________________________________________________
- Is it more economical to shop at Marks and Spencer?
Yes No
- In all fairness how would you compare Marks and Spencer value brand to that of other brand? Choose one of the ratings.
1 2 3 4 5
TASK 2: BE ABLE TO UNDERSTAND A RANGE OF TECHNIQUES TO ANALYSE DATA EFFECTIVELY FOR BUSINESS PURPOSES
Your line manager wants to know more about M&S food department’s annual income in the different branches in East London. He has asked you to conduct more research, and you grouped the results as follows:
| Branches | Annual income /£m | No. of stores (frequency) |
| Barking | 15 | 4 |
| East ham | 20 | 6 |
| White chapel | 15 | 8 |
| Hackney | 25 | 12 |
| Ilford | 20 | 5 |
| Algate East | 15 | 14 |
| Docklands | 35 | 7 |
2.1 Create information for decision making by summarising data using representative values
As presented the Mode, Median and Mean have been calculated for the number of stores (frequency) and annual income during one year into the company Marks and Spencer, in east London.
Mean – is the total sum of the observations divided by the number of observations.
Mean: 15+20+15+25+20+15+35=145
145/7=20.71
Median – is the value of the middle member of distribution once all the items have been arranged in order of magnitude.
Median: 15 15 15 20 20 25 35
Median = L + (n/2 – f /f) x i
(7+1)/2= 8/2=4
Median number is 20.
Mode – is an average that indicates the most frequent occurring value
Mode: The mode number is 15, because is the most frequent number in our list.
2.2 Analyse the above results to draw valid conclusions in the context given in the scenario (You have to make sure the Information is created using representative values and Analytical Report).
Looking at the results obtained in 2.1 Marks and Spencer can use these as a guideline into how they position products into the market. Marks and Spencer need to consider the needs of customers coming into their stores by thinking about the quality of their products in the market.
They need to consider the needs of customers coming into their stores by thinking about the quality of products they bring into the stores, the types of products and how they price these/their products because pricing products too high can make products unaffordable to customers pushing them to go to a different stores for example Poundland or Asda where the products are cheaper, creating losses for them, products needed may not be available to them pushing them to also go elsewhere. Marks and Spencer can also make good use of results to categorise or target their customers for example Marks and Spencer offers loyalty/store cards to customers, they can check the spending habits of consumers through this and they can bring in products that suits the needs of their customers.
As presented above the Mode, Median and Mean have been calculated to know more about M&S food department’s annual income in the different branches in East London.
Mode in a list of records is the number that occurs repeatedly, if there is one. Our mode is £15 million as this are the more often number that we can notice from all M&S stores in East London, we are looking at the next branches Barking with 4 stores, Whitechapel with 8 stores and Algate East with 14 stores. In total are 26 stores, almost half of the total stores considered in east London.

Mean (average) is the total sum of observations divided by the number of observations.
In M&S, the mean or average sales for one year in one supermarket are £20, 71. As we can notice, the stores that are the closest to the average are East Ham and Ilford branches.
Median is the value of the middle member of distribution. To find the median, we need to organise each number in order by size; the number in the middle is the median.
In Marks and Spencer the median is 20, so this includes East Ham and Ilford branches.
The M&S branch that has the highest income is Docklands with £35 m per year, followed by Hackney with £25m per year, this result from the fact that the income of the customers that are frequenting this area is very high comparing to the lowest income branches which are Barking, Whitechapel and Algate East with £15 m per year each.
We need to take into consideration even the facts that in Docklands are only 7 stores and in all other three branches are 26 stores. This means that these 7 stores are more productive than all the rest, reason being the clients have a higher income and they can afford to choose M&S for the quality of their products.
The mean and median could be compared with earlier year’s averages to see if they are increasing or decreasing, Management will look for reasons for any changes. To check performance, management might also want to compare these figures with industry averages and with their own budgets for the year, as this will improve planning for following years.
2.3 Analyse data using measures of dispersion to inform the strategy to improve sales
Dispersion is also identified as scatter, spread or variation and it measures the degree of variation between a set of scores. The word dispersion is used to indicate the degree of heterogeneous in the records.
For the analyses of dispersion we want some measures which illustrate whether the dispersion is small or large. There are two main categories of measures of dispersion: absolute measures of dispersion and relative measures if dispersion.
The absolute measures include the range, quartile deviation, mean deviation, and standard deviation and variance.
The Range data is the difference among maximum and minimum value in a set of data.
Our range is the difference between the maximum incomes per year in M&S branches which is £35 m, this is the dispersion maximum and the minimum income which is £15m, and this is the dispersion minimum; as a result we have our range data £20m.
Interquartile Range
The interquartile range is called also IR and is a measure of where the “middle fifty” is in a data set. It is the difference between the first and the third quartiles.
IR= Q3-Q1
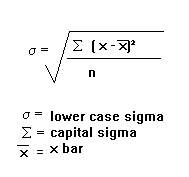
Standard deviation
Standard deviation (SD) is usually the most used measure of dispersion. It is a measure of spread of data about the mean. SD is the square root of sum of squared deviation from the mean divided by the number of observations.
In the case of Marks and Spencer there is an effect on different areas where M&S stores are positioned. Because of sales or promotions people buy more from food sector in the areas where people’s income is higher, and the sales decrease in the areas where people’s income is smaller.
2.4 Explain how quartiles, percentiles and the correlation coefficient are used to draw useful conclusions in the given business context
Quartile constitutes one of the three points that divide a range of data or population into four equal parts.
The first quartile Q1 also called the lower quartile or 25th percentile, and is defined as the middle number between the smallest number and the median of the data. The second quartile Q2 is at the 50th percentile. The third quartile Q3 is at the 75th percentile, and is the middle value between the median and the highest value of the data set.
In our case, the percentile Q1 is 17.5, as the smallest number of the data is 15 and the median is 20, so the Q1 is the middle number between this two; Q2 is 8.75, as the second quartile is at the 50th percentile and Q3 is 27.5, as the third quartile is the middle value between the median which is 20 and the highest value of the data set.
Quartiles and percentiles can be useful to identify months of particularly high or low sales of desks or chairs, for stock ordering or pricing decisions. For example prices might be reduced in months of very low sales, to try to reduce stock.
‘Quartiles is a collective term for quartiles, deciles, and percentiles and any other dividing point for analysing frequency distribution’ (Bpp learning media, 2013).
‘Percentile is where the data set is arranged in ascending and descending order, the pth percentile is a number such that p% of the observations of the data fall below and (100-p)% of the observations fall above it’ (Bpp learning media, 2013).
Correlations are ‘variables said to be correlated when the value of one variable is related to the value of another’ (Bpp learning media, 2013).
Coefficient of correlation ‘measures the degree of correlation between two variables’ (Bpp Learning media, 2013).
If Marks and Spencer trains their staff/employees this will make the staff more skilled which causes production to be increased. If production increases sales will also increase and the revenue will also increase making more profits for Marks and Spencer’s.
If the cost of production is low, Marks and Spencer will then be able to produce more. Marks and Spencer produces their own brand products for e.g. as this will cost them less to produce compare to purchasing and selling other brands. As production increases for them cost also reduces (economy of scale).
If resources are allocated efficiently and effectively it saves them administratively for example by having the right staff in the right places and they are able to manage costs across the departments, this can increase productivity. However, if one department is overstaffed and another area is lacking staff this can create room for diseconomy of scale (see diagram below).
Marks and Spencer can buy their fresh fruits in bigger quantities than from a small supplier of vegetable and fruit as this reduces the cost per unit and it enables them to buy in bulks and achieve discounts through purchases (See the diagram below).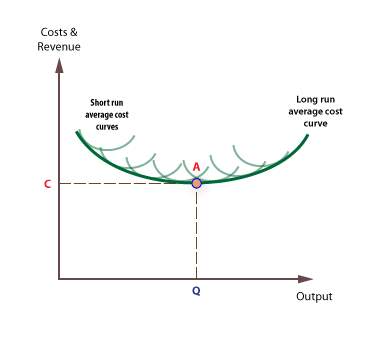
On the other hand, if the staff at Marks and Spencer’s motivation is low it creates potential for diseconomy of scale internally as it results in low productivity. The productivity per employee also reduces.
It is very easy for a big supermarket like Marks and Spencer they can suffer poor communication if they are not careful as they might find it difficult to maintain the effectiveness of informing departments, divisions between their head offices. Time also have a big part to play in the dissemination of information because if time is not created or given problems will occur in regards to how quick responses are being made in accordance to the change of market conditions.
TASK 3: BE ABLE TO PRODUCE INFORMATION IN APPROPRIATE FORMATS FOR DECISION MAKING IN MARKS AND SPENCER
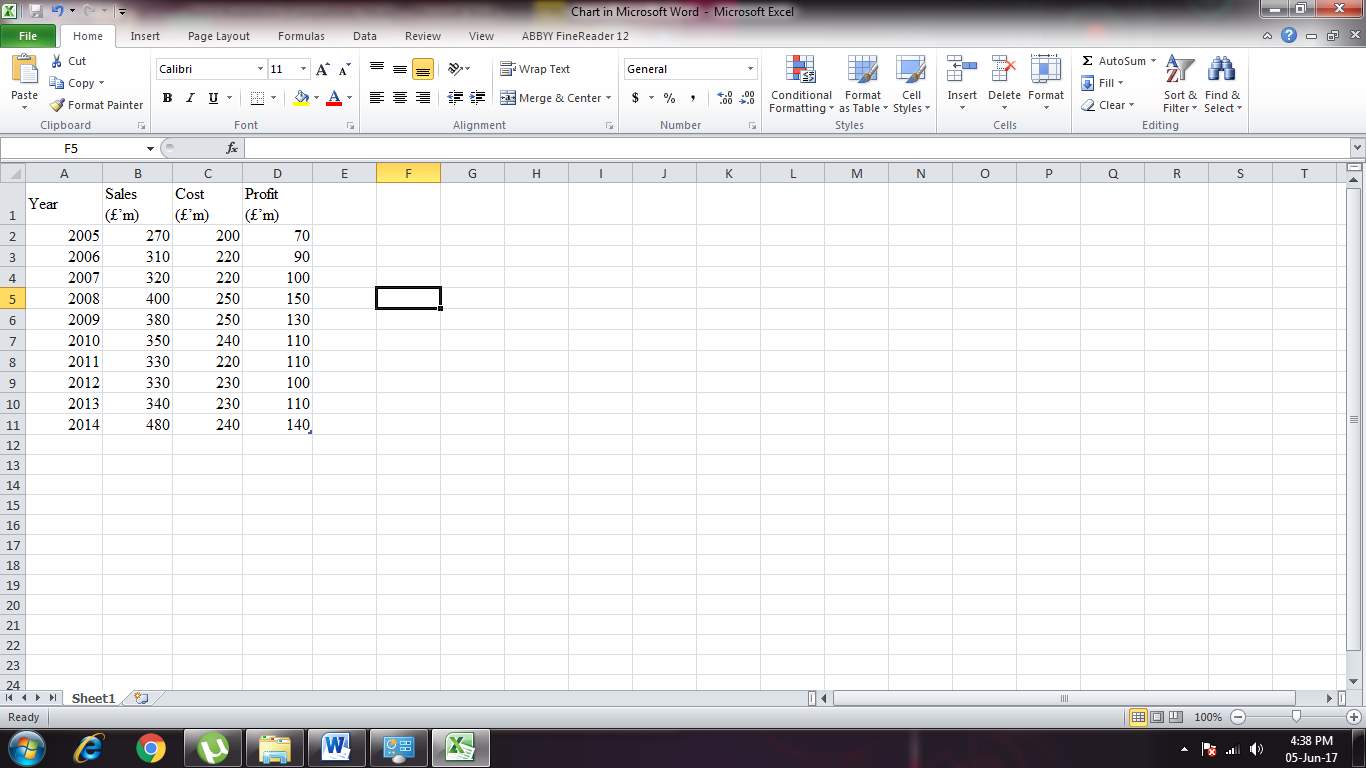
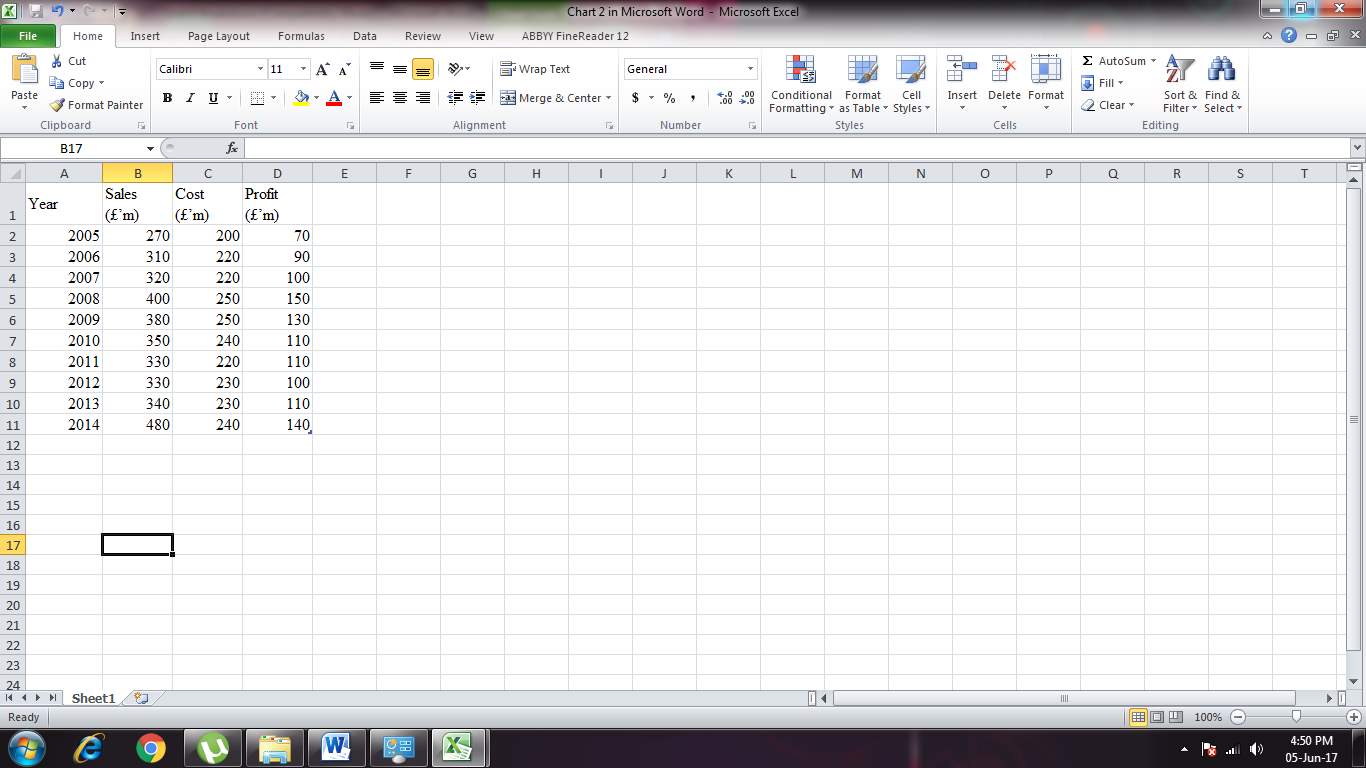
Your line manager has provided data of M&S food sales, cost and profit from the last 10 years and has asked you to make them presentable for the meeting.
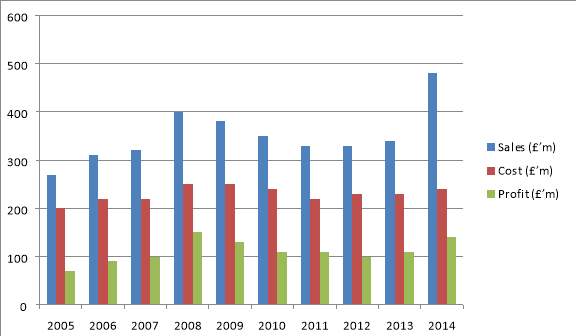
| Year | Sales (£’m) | Cost (£’m) | Profit (£’m) |
| 2005 | 270 | 200 | 70 |
| 2006 | 310 | 220 | 90 |
| 2007 | 320 | 220 | 100 |
| 2008 | 400 | 250 | 150 |
| 2009 | 380 | 250 | 130 |
| 2010 | 350 | 240 | 110 |
| 2011 | 330 | 220 | 110 |
| 2012 | 330 | 230 | 100 |
| 2013 | 340 | 230 | 110 |
| 2014 | 480 | 240 | 140 |
3.1 Use the above data to produce graphs using spreadsheets and draw valid conclusions based on the information derived (please ensure that it is a report with relevant graphs to aid relevant conclusions)
In a short paragraph, draw a generic conclusion based on the information derived
As we can notice the chart from above, the sales and the profit are in a continue correlation, as the cost is nearly the same. As a conclusion we can say that if the sales are going up this means that the profits are also growing.
The profit is the smallest in 2005, at the beginning as probably there were a lot of expenses but is going up in 2014.
Also we can see that the sales are going up from 2005 to 2008 and then are going dramatically down, as in 2008 was the financial crisis was the worst economic disaster since the Great Depression of 1929. It occurred despite aggressive efforts by the Federal Reserve and Treasury Department to prevent the U.S. banking system from collapsing and led to the great recession. After the financial crisis is 2008, we can notice that the sales are going up again together with the profits, reaching the best results in 2014.
3.2 Now create trend lines in spreadsheet graphs to assist in forecasting for specified business information (this should be a well created graphs or statistical diagrams to aid business to forecast future information
Produce sales and profit line graphs showing trend lines which can be used for projecting both the sales and profit.
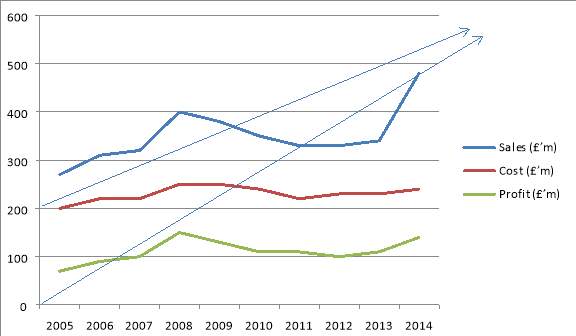
Explain extrapolation for forecasting (reliability)
Extrapolation methods use historical data on the series of interest. Exponential smoothing is the most popular and cost effective of the extrapolation methods. It implements the principle that more recent data should be weighted more heavily and also seeks to “smooth” out seasonal and/or cyclical fluctuations to predict the direction in which the trend is moving.
Once evidence has been gathered, the future can be predicted i.e. sales can be forecasted. Extrapolation involves taking the past and extending it into the future.
We can also add the idea of probability to this prediction of the future. If sales, although showing a general trend of increase, have fluctuated, we can allow for this. The outer lines show possible variations from the simple trend extrapolation. The green line shows the profit and we can forecast that is going to increase in the next year because is in connection with the blue line that is representing the sales. The red middle line shows the cost and we can forecasting that is going up as is in correlation with the sales and profit. Based on past evidence we can build in factors such as the economic cycle and possible marketing campaigns of competitors.
3.3 Prepare a business presentation using suitable software and techniques to disseminate information effectively
Prepare a presentation using software such as Microsoft PowerPoint, for the upcoming meeting. Please add in your presentation;
Find attached presentation.
3.4 Produce a formal business report
Formal business report
To: The Management of Marks and Spencer
From: Business Consultant
Subject: Report on the threats to Marks and Spencer and how to respond to these threats
Date: June 20th 2017
EXECUTIVE SUMMARY
The discounted food retail market is highly competitive because of the dynamic environment in which it operates as businesses. It is extremely important therefore for the management team of Marks and Spencer to create a plan which they can strategically follow to respond to the threats in the environment in which it operates.
The intention for this report is to outline the threats faced by Marks and Spencer in the United Kingdom in which possible suggestions will be made to tackle these threats, to improve their sales.
Purpose of this report
I made this report for Marks and Spencer, which is a High Street Retailer in the UK, recommended methods for the collection of data to improve upon their revenues for the food section of their business activities, where sales have fallen drastically.
Aim and objectives
To create a plan for the collection of primary and secondary data regarding how sales can be improved in the food sections of Marks and Spencer.
To accomplish the making of strategic and tactical decisions for Marks and Spencer as a whole to overturn their misfortunes in the food section.
BUSINESS ANALYSIS
Current status
As part of the management team of Marks and Spencer, which is a High Street Retailer in the UK, is necessary to assist them in making strategic decisions to improve upon their revenues for the food section of their business activities, where sales have fallen drastically.
Research method
| Primary Data |
| Examples of primary data that can be used would be questionnaires, surveys, through the post or interviewing customers on a one-to-one basis. All this will be carried out, outside the M&S in the local area, as this will enable us to collect information directly from the customers. It will be interviewed minimum 30 people all over the age of 18+. |
| Secondary Data |
| This data will be collected through the use of journals, books, research reports and internal records of M&S, using information such as the feedback of customers, reports made by others through research, any possible complaints made by customers, loyalty store cards as it has/possess information about the customers.Product differentiation strategies
Although Marks and Spencer is competing with Tesco, ASDA and Sainsbury |
Sales analysis
Sales are going up from 2005 to 2008 and then are going dramatically down, as in 2008 was the financial crisis was the worst economic disaster since the Great Depression of 1929. It occurred despite aggressive efforts by the Federal Reserve and Treasury Department to prevent the U.S. banking system from collapsing and led to the great recession. After the financial crisis is 2008, we can notice that the sales are going up again together with the profits, reaching the best results in 2014.
Profit analysis
Sales and profit are in a continue correlation, as the cost is nearly the same. As a conclusion we can say that if the sales are going up this means that the profits are also growing.
The profit is the smallest in 2005, at the beginning as probably there were a lot of expenses but is going up in 2014.
COST AND BENEFIT ANALYSIS
Business improvement forecast
There are various ways in which Marks and Spencer can respond to threats in the market they are operating in. Before anything can be done Marks and Spencer needs to recognise that their response to threats is correlated to the attitudes and behaviors of customers as this is vital. In order to do this they need to be familiar with the reaction of customers to each response.
Marks and Spencer can employ some of the response strategies below (to improve their services to consumers).
They can use pricing strategies as they have introduced ‘I’m cheaper – everyday low prices’ (Marks and Spencer case study) as it is greater for shoppers. Marks and Spencer faces threats from rivals as they may also do the same but Marks and Spencer can deal with this threat by been ahead of rivals and remaining consistent with price change (good quality at a cheaper price.)
Investment requirements
The initial investment is the same and expected life and is equal to £150m.
Looking at the projects, and also considering the positive NPV, the project A has a valuable activity since it has the positive NPV of £156,945,936.38. As the project creates a positive NPV it is producing a return which is greater than 5%, the discount rate used. Project B has NPV= £158,318,172.50 and is higher that Project A.
According to the calculation, the firm should choose the Project B. As showed above, the second project has significantly higher NPV than the first one. The IRR, as we can see in the above table is the same in both projects and is 12%.
Timescale involved
Critical Path Analysis formally identifies tasks which must be completed on time for the whole project to be completed on time, and also identifies which tasks can be delayed for a while if resource needs to be reallocated to catch up on missed tasks.
All activities must follow this order as none of them can be completed without the previous one.
All activities in red are critical; which means that if they take longer than estimated or are delayed, this will mean completion of the project takes more than 40 days; this will not extend the 40 day completion unless the delay is longer than the activity float.
CONCLUSION
Possible scenario
Marks and Spencer face stiff competition across the UK food sector with rising inflation, recovery among the main four supermarkets and the continued growth of the discounters. Food retailers and suppliers also face cost headwinds due to rising raw material prices and the depreciation of sterling. However, through listening to their customers and monitoring the market, M&S will keep on top of changing shopping habits. Consumers remain as savvy as ever and relish innovation. They are also doing smaller ‘convenience’ shops. These trends play to M&S strengths.
RECOMMENDATIONS
Source of funding
The principal financial risks faced by the Group are liquidity and funding, counterparty, foreign currency and interest rate risks. The policies and strategies for managing these risks are summarised on the following pages:
Liquidity and funding risk
- The Group’s funding strategy ensures a mix of funding sources offering sufficient headroom, maturity and flexibility and cost effectiveness to match the requirements of the Group.
- Marks and Spencer is financed by a combination of retained profits, bank borrowings, medium-term notes and committed syndicated bank facilities.
- Operating subsidiaries are financed by a combination of retained profits, bank borrowings and intercompany loans.
Resources
M&S creates long-term value through the effective use of our resources and relationships. They manage these in line with our core values of Inspiration, Innovation, Integrity and In Touch.
M&S resources:
FINANCIAL: Generating returns for our stakeholders through effective management of our financial resources;
PRODUCTS & CHANNELS: Maintaining our channels and supply chain infrastructure to meet customer demand;
INTELLECTUAL CAPITAL: Strengthening our brand through creation and protection of our intellectual property.
Timescale
In food, M&S expect space growth of c.7%, weighted towards the end of the year as they will open c.90 new Simply Food stores. M&S will anticipate input cost inflation will slightly outweigh operational efficiencies with a resulting decrease in gross margin of between 0 and -50 basis points largely weighted towards the first half.
They expect UK cost growth of c.2.5 to 3.5% as a result of new space, cost inflation and the annual of investment in customer service, partly offset by Head Office restructuring efficiencies. Cost growth will be weighted towards the first half of the year.
The 2017/18 effective tax rate on adjusted profit before tax is expected to be around 21% as a result of the Scottish Limited Partnership structure.
Capital expenditure is expected to be c. £400m as we increase the rate of Simply Food store openings.
Measurement
While profits were significantly down, M&S chief executive will continue to believe in good cash management, a robust balance sheet and a progressive dividend policy. They know how important our dividend is to shareholders big and small. Internationally, they will explore new territories with our franchise partners and will continue to develop talent within the organisation.
TASK 4: BE ABLE TO BE ABLE TO USE SOFTWARE-GENERATED INFORMATION TO MAKE DECISIONS IN MARKS AND SPENCER
Your Line Manager is planning to construct a new section for foreign food products and predicts the following activities to take place.
4.1 Write a reflective report on the how you used information processing tools
Management Information Systems (MIS) is the study of people, technology, and organisations (Eller, 2016).
An MIS is a system aimed to manage information in a company or organisation. This contains employees, departments, projects, clients, finances, and other types of data. At its most universal level, an MIS might include non-computer based elements, such as the structural hierarchy of a business. Nevertheless, in the computing world, an MIS normally refers to the hardware and software used to manage information.
Through MIS, M&S is capable to be up to date and to compare the “in-out” physical and online stock: screen needs to be the same with the bare-code product positioned in the firm’s room. The major drive of a stock control system is to have enough stock accessible in a known place, in order to fulfill customer’s requirements regarding their food choices. So, M&S can use MIS for avoiding unnecessary stock and costs.
MIS can support to develop the extension of selling home groceries and food operations. It can also help to succeed numerous information systems so that they best serve the requirements of managers, staff and customers. MIS can help M&S to make systems for finding and storing information and offers a comprehensive understanding of computers databases, networks, computer security, and lots more.
MIS produces reports involving the cost level, value and damages of Inventory. Requirement Planning-MRP reports that integrate manufactories and production process as sales, stocks.
In an ever changing business environment like the one Marks and Spencer is operating in, the use of Management Information Systems are essential to Marks and Spencer to help them to keep up with the everyday, constant demands of the consumers. MIS is the system where information is provided to many businesses for the effectiveness of decision making using minimum time.
MIS is unique in the sense that the information differs from that of other information systems used. Marks and Spencer uses MIS to enhance the way in which things are done. It is used for the storing, analysing and facilitating the strategic, tactical and operational activities of Marks and Spencer Plc.
The level of management in Marks and Spencer is split into three levels; strategic level, business level and functional level just like any other business and each level contributes to the decisions whether it bears a positive or negative impact on them.
At the strategic level are the CEO, Director of Marks and Spencer are the decision makers.
At the business level are the managers contributes to the decision making and also to see that policies are implemented.
At the operational level are store assistants, junior staff at this level they implement strategies given by the managers.
4.2 Prepare a project plan for an activity and determine the critical path
Your Line Manager is deciding whether to go ahead with the Project (of setting up a new section to an existing M&S food or create a build a separate M&S food chain. He therefore needs to choose between the two mutually exclusive projects (internal or external), as economic resources are limited. Both projects have the same initial investment and expected life. The company anticipates a Discounting Factor of 10% and future net cash flows of the projects are as follows:
|
What is project management?
Project management involves planning and organisation of a company’s resources to move a specific task, event or duty toward completion. It typically involves a one-time project rather than an ongoing activity, and resources managed include human capital and financial capital. A project manager helps to define the goals and objectives of the project and determines when the various project components are to be completed and by whom; he also creates quality control checks to ensure completed components meet a certain standard.
Please prepare a project plan using the activities from your scenario and determine the critical path using a diagram (you can use Gantt or Pert chart).
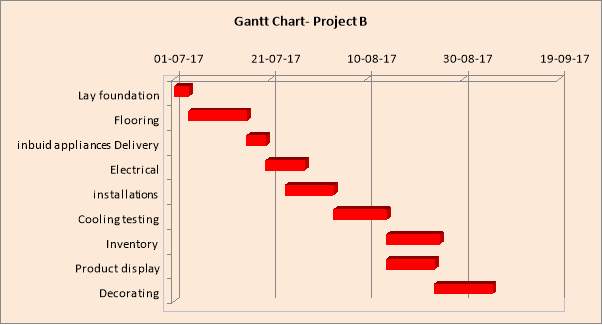
Explain the critical activities and the critical path
Critical Path Analysis formally identifies tasks which must be completed on time for the whole project to be completed on time, and also identifies which tasks can be delayed for a while if resource needs to be reallocated to catch up on missed tasks.
Above is a Gantt chart with a Network Diagram below it of the Project, prepared with Microsoft Excel.
All activities must follow this order as none of them can be completed without the previous one.
All activities in red are critical; which means that if they take longer than estimated or are delayed, this will mean completion of the project takes more than 40 days; this will not extend the 40 day completion unless the delay is longer than the activity float.
4.3 Use financial tools for decision making regarding the strategy to improve sales. You have to apply practical calculation of data analysis linked with appropriate tools to aid decision making
| Year | Internal | External | PA Internal | External present value |
| Net Cash flow | Net Cash flow | 10% | ||
| Investment | -£150,000,000 | -£150,000,000 | -150000000 | -150000000 |
| 1 | £30,000,000 | £30,000,000 | 27272727.27 | 27272727.27 |
| 2 | £40,000,000 | £50,000,000 | 33057851.24 | 41322314.05 |
| 3 | £60,000,000 | £50,000,000 | 45078888.05 | 37565740.05 |
| 4 | £30,000,000 | £40,000,000 | 20490403.66 | 27320538.21 |
| 5 | £50,000,000 | £40,000,000 | 31046066.15 | 24836852.92 |
| NVP | £156,945,936.38 | £158,318,172.50 | 156945936.4 | 158318172.5 |
| £6,945,936.38 | £8,318,172.50 | 6945936.38 | 8318172.504 | |
| IRR | 12% | 12% | ||
Looking at the projects, and also considering the positive NPV, the project A has a valuable activity since it has the positive NPV of £156,945,936.38. As the project creates a positive NPV it is producing a return which is greater than 5%, the discount rate used. Project B has NPV= £158,318,172.50 and is higher that Project A.
According to the calculation, the firm should choose the Project B. As showed above, the second project has significantly higher NPV than the first one. The IRR, as we can see in the above table is the same in both projects and is 12%.
The Net Present Value of the Project A is £156,945,936.38. This means that the project is worthwhile or viable. This also means that the management of Marks and Spencer could go ahead with the project by the first principle, the decision is that if NPV>0, then the project is viable since the NPV=156,945,936.38. However, it is at the discretion of the management of Marks and Spencer to go ahead with this project or not but if he/she decides to go for NPV the time value of money is considered and there is a complete measure of return. (NPV is positive so the project can go ahead as it is a profitable one)
NPV as a financial tool gives management time value of money, the years in which the project will last, it informs shareholders if they are making money or not and it allows managers to set higher discount rates for that are more risky. However, NPV can’t be easily explained to managers and the cost of capital is always required projects.
Conclusion
Business Decision Making has established how a business can progress with technique by using a diversity of sources like primary and secondary data information.
BDM reveals also the significance of a Business to apply a range of techniques that examine data efficiently like representative values, measures of dispersion and calculation.
BDM topic illustrates the advantage for a Business when using and applying spread sheets interpretation of graphs like lines, pie, bar charts, scatter graphs, linear and trend lines.
In order to create a real and competent decision, BDM directs the organisation to practice software generated information containing computer and information processing tools for operational, tactical and strategic levels of the company.
References
- Arnold, G. (2008) Corporate Financial Management, 4th ed. Harlow: Pearson Prentice Hall.
- Atrill, P. (2009) Financial Management for Decision Makers, 5th ed. Harlow: Financial Times. Prentice Hall.
- Atrill, P. & McLaney, E. J. (2011) Accounting and finance for non-specialists, 7th ed. Harlow: Financial Times Prentice Hall.
- Beynon-Davies P – Business Information Systems (Palgrave Macmillan, 2009)
- Business Decision Making (BPP Publishing,2013) ISBN: 9781445368238
- Barry Elliott & Jamie Elliott (1997). Financial Accounting and Reporting. Second edtion – Updated 1997 edtion. Prentice Hall.
- Bisgay, Louis. “Trends in Financial Management.” Management Accounting, May 1997.
- Bruns, William J. Accounting for Managers: Text and Cases, 2nd ed. Cincinnati: South-Western, 1999.
- Collier, P.M. (2009) Accounting for Managers, 3rd ed. London: John Wiley & Sons Ltd.
- Colin Drury: Costing, an introduction. 3rd edition. International Thompson Business Press. 1993
- Fraser, G. (1990) Decision Accounting, Oxford: Basil Blackwell Ltd.
- Garrison, Ray H. Managerial Accounting. 8th ed. Boston: Richard D. Irwin, Inc., 1996.
- Horngren, Datar and Foster, Cost Accounting – A Managerial Emphasis, 11th edition (Prentice Hall 2003).
- Newbold P et al – Statistics for Business and Economics (Pearson Education, 2009)
Cite This Work
To export a reference to this article please select a referencing stye below:
Related Services
View all


DMCA / Removal Request
If you are the original writer of this assignment and no longer wish to have your work published on UKEssays.com then please click the following link to email our support team:
Request essay removal