Research for Opening a Restaurant
| ✅ Paper Type: Free Essay | ✅ Subject: Business |
| ✅ Wordcount: 3265 words | ✅ Published: 13 Sep 2017 |
Data collection Plan:
Data collection is the methodology of gathering useful information and then handling it through filtering out the immaterial information and making it more useful and appropriate to be used into the area of interest. It not only helps us in getting answers to the research questions but also assess outcomes through proper evaluation. In case of opening a new restaurant in London we are going to be focusing the target market that includes customers available locally in the central London area. In this research case the research question is based on the taste, preferences, and factors that are attractive for the customers in a restaurant. For this reason we need to be focused on what are the sources that we can use to attract more and more customers to our restaurant. For example some customers may like location, other may like the price or the flavor of the food. We have selected Black friars restaurant in order to conduct research and come up with ideas that can boost sales and help restaurant grow int he future.
Primary Data:
The Primary Source of information is identified as a part of the researcher’s own work. The information is not taken from outside and is absolutely pure knowledge of the researcher himself as it is based on the researcher’s own judgment that he agrees to after conducting a certain research work. So level of biases in this kind of information collection are low. This information is separated the first run through from the Research itself, such as planning a questionnaire, and is done for the most part under the supervision of a specialist. Hellman, K. (2005)
Secondary Data:
This is the type of collection of data from magazines, journals, articles and books. Therefore, collection of data from the research that has already been done by someone and rely one’s judgment based on that is referred to be as a secondary data collection.
Preference:
Since Secondary information gathering is not exceptionally dependable as the exploration work might be influenced by the predispositions or might be inadequate because of some other unforeseen factors, in this way, in the event of Black Friar restaurant we will utilize essential information accumulation method and would plan an examination address and will observe into what clients are really searching for in an eatery and would could it be that draws in a large portion of them to visit. Hence we will take 100 respondents who are going to be from various foundations and could be our planned understudies later on. Since this exploration is centered around a market specialty I.e. youthful understudies we are not taking into interest anyone who has as of late gone to an eatery or the individuals who are not extremely partial to eatery and went to them long time prior. For this reason a questionnaire is planned which will be dispersed through web, online networking, mobile applications and as a rule be given in printed versions to be filled in Central London. Heylen, J. P., Dawson, B. and Sampson, P. (2007)
Survey Methodology:
The survey strategy we favored depends on a questionnaire. A questionnaire is a dependable technique for a review and is reasonable when contrasted with the other study strategies. A decent survey based on a questionnaire is short, exact, with clear choices, and with less confounded inquiries.
Data Sampling:
Since the research is mainly to be taken on the customers visiting different restaurants we will rely on three major categories of sample population:
1. Young people who frequently visit restaurants.
2. People who visit restaurant in Central London specifically
3. People who are looking for good restaurants.
It is not easy to find the sample population randomly on the streets so therefore we have planned to visit central London by ourselves and distribute questionnaires outside restaurants and food places.
General Rule for composing a Questionnaire:
Mentioned below are the guidelines that we took after to outline a questionnaire:
1. We kept away from all the confounded inquiries and place them in basic way so that the respondents could without much of a stretch comprehend them and answer them.
2. We attempted to stay away from ambiguous and uncertain words to maintain a strategic distance from any perplexity.
3. We have utilized an ordinal size of alternatives for the reaction for simple comprehension.
4. We have endeavored to keep our survey exact and short for fast reactions.
Choosing the method of contact:
There are diverse methods of reaching respondents. A few surveyors utilize messages, online networking, pamphlets, letters by post or handouts. We utilized the printed type of survey and conveyed it by hand. This was a time taking procedure yet was most dependable as we by and by approach respondents and attempt to get their reaction on the questions inquired. Hellman, K. (2005)
DESIGN A QUESTIONNAIRE:
Question 1: what is your Gender?
A: Male
B: Female
Question 2: What is your age group?
A: 0-18
B: 19-25
C: 26-39
D: 40-55
E: 55+
Question 3: How often do you visit a restaurant?
A: Every day
B: Once a week
C: Once a month
D: Once a year
E: Never
Question 4: What do you look for while choosing a restaurant?
A: Price
B: Quality
C: Ambience
D: Location
E: Others
Question 5: What food do you like to buy?
A: Continental
B: Chinese
C: Indian
D: Traditional British
E: Mexican/American
Question 6: How much do you normally spend in a restaurant?
A: Less than £50
B: £50 – £99
C: £100 – £149
D: £150 – £200
E: Above £200
Question 7: How do you prefer your cuisine to be cooked like?
A: Plain
B: Spicy
C: Boiled
D: Flavored/seasoned
Question 8: Do you prefer location when you visit a restaurant?
A: YES
B: NO
C: DON’T KNOW
Q1:
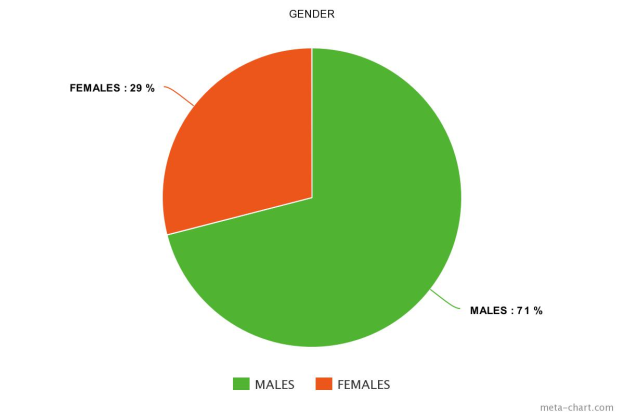
Questionnaire was distributed among 100 respondents out of which 29 were female and 71 were male. It is important to highlight the gender in a questionnaire because biases in regards to food might be different among genders. Females are more conscious of healthy diet compared to males and hence they rely more on salads. On the other hand, some females prefer spicy food compared to men and some men prefer to have fast food items like pizza, burger and fries without considering the fatty nature of the food. However, we have put an ultimate effort not to discriminate our research outcomes based on gender, while clear equality and right of opinion is given to both the genders during the research process.
Q2: Age Group distribution:
|
Age |
Population |
|
0-18 |
18 |
|
19-25 |
42 |
|
26-39 |
24 |
|
40-55 |
11 |
|
Over 55 |
5 |
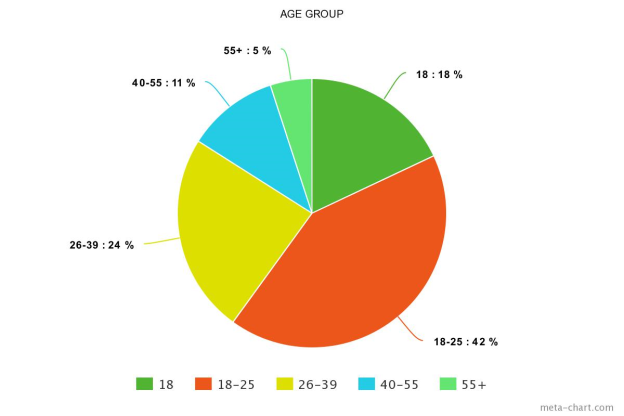
The biggest chunk of respondents are from the age groups that are young and are between the age of 18 to 39 years. Out of 100 respondents this age group consists of 66% of the participants out of which 42% are in their 20’s. The reason of contacting young people for this research as a wider group is because they are more social, outgoing and enthusiastic about food and restaurants visits.
Q3: How often do you visit a restaurant
|
Options |
No of respondents |
Total respondents |
Response % |
|
Everyday |
6 |
100 |
6% |
|
Once a week |
37 |
100 |
37% |
|
Once a month |
42 |
100 |
42% |
|
Once a year |
12 |
100 |
12% |
|
Never |
4 |
100 |
4% |
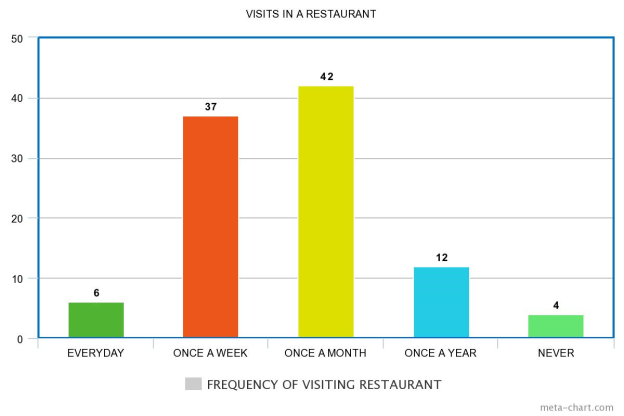
From the chart above, one can easily understand that the restaurant visits are neither very frequent on daily basis and never are missed. So there are people who prefer to visit a restaurant on weekly basis and a good number visit a restaurant on monthly basis also. Around 37% of the participants visit the restaurants on weekly basis. These must include those with higher income and lavish lifestyle and can afford restaurants every week. A top 6% are those who visit restaurants everyday. These might include restaurant employees or restaurant owners. A good 42% of participants visit restaurants every month. These are the ones who love outing but due to their busy life style are less often finding time to go out and be socialize.
Q4: What attracts you in a restaurant?
|
Options |
No of respondents |
Total respondents |
Response % |
|
Price |
19 |
100 |
19% |
|
Food Quality |
31 |
100 |
31% |
|
Location |
20 |
100 |
20% |
|
Ambience |
27 |
100 |
27% |
|
Others |
3 |
100 |
3% |
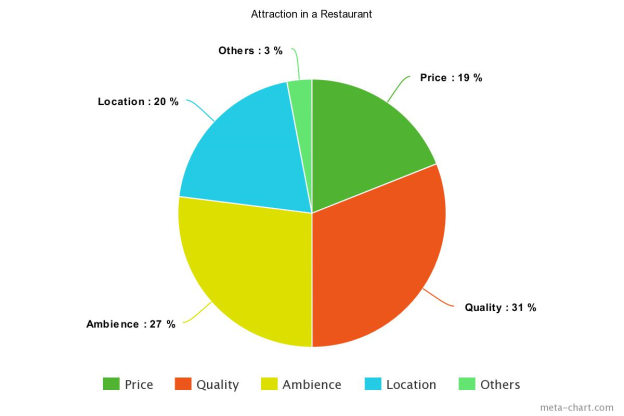
As evident from the diagram, Londoners are less sensitive to price and are more quality oriented. Ambience plays a vital role in the success of a restaurant. It includes, music, decor, environment and the service. Almost 27% of the participants prefer ambience over price and quality when selecting a restaurant. And 31% prefer quality of food. This means that reasonably high prices would not turn the customers down unless the quality is compromised or ambience is not upto the mark.
Since London is a costly place and particularly Central London is taken as a costly territory, in this way individuals eating out here are less value touchy and that is the place the eatery can make its real lump of overall revenue.
Q5: Type of Food:
|
Options |
No of respondents |
Total respondents |
Response % |
|
Chinese |
29 |
100 |
29% |
|
Continental |
19 |
100 |
19% |
|
Indian |
21 |
100 |
21% |
|
Traditional British |
27 |
100 |
27% |
|
Mexican/American |
4 |
100 |
4% |
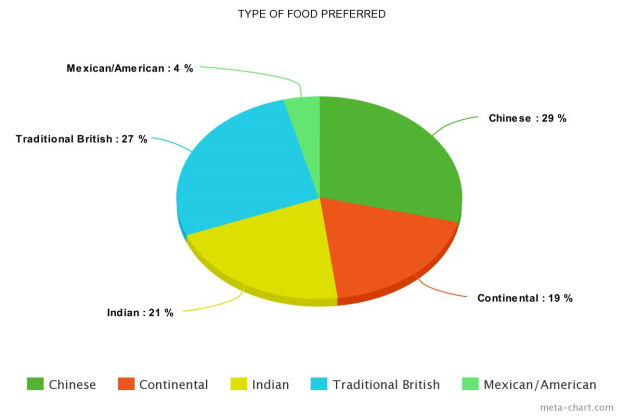
As the pie chart above shows, Since we definitely knoW, Chinese food is most loved everywhere throughout the world because of its medical advantages and crude nature. In any case, British individuals still lean toward their own food which is 27% while Chinese beats the traditional food and stays at 29% highest participants’ preferences and Indian at 21%. From this information, a manager can finish up effectively that if the eatery is opened with principle line of British and Chinese food, while extra Mexican and Indian cuisines would include in the estimation of the menu also, they can definitely expand the quantity of potential clients. One can without much of a stretch recognize less prevalence of American sustenance since Chinese treats have occurred the world over. In this manner, including more dishes would just include the disarray among the clients. Having British, Chinese and Indian nourishment food in the menu would pull in the most extreme number of clients for the eatery and has incredible potential for benefits.
Q6: Average spending in Restaurant:
|
Options |
No of respondents |
Total respondents |
Response % |
|
Under £50 |
28 |
100 |
28% |
|
£50 – £100 |
55 |
100 |
55% |
|
£100 – £200 |
9 |
100 |
9% |
|
£200 – £250 |
6 |
100 |
6% |
|
Over £250 |
2 |
100 |
2% |
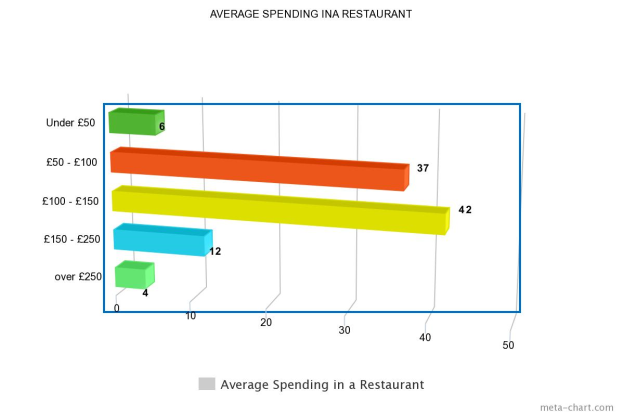
The chart above shows that most of the customers are generous in spending money and spend between 50 to 150 pounds in a restaurant during their one visit. Almost above 75% of the participants are those who spend more than 50 and less than 150 pounds in a restaurant. The very small amount of 4% and 12% participants are those who spend between 150 and 250 pounds or even more. These are the participants who are high earners and do not mind spending a lot. Londoners are food lovers and do not seem close fisted at all. They are generous in their spending and a restaurant with good quality, right location, perfect ambience, and right types of food would make great profits in a place like Central London.
Q7: How do you like your food to be cooked?
|
Options |
No of respondents |
Total respondents |
Response % |
|
Plain |
59 |
100 |
59% |
|
Spicy |
23 |
100 |
23% |
|
Boiled |
11 |
100 |
11% |
|
Seasoned/flavored |
7 |
100 |
7% |
The vast majority in Britain can purchase processed/ready made and frozen food from the general stores. Cooked food is infrequently observed anyplace. Because of that reason it has immense request in a bustling city like London where individuals have less time to do the sustenance with hands and utilize prepared or instant nourishment even in restaurants. That is the reason one can see a high inclination of made sustenance in the diagram above. Being wellbeing cognizant yet taste amazing too Londoners jump at the chance to have their food in as simple and plain as could be allowed however ought to be loaded with taste and flavoring moreover. Subsequently 59% of the respondents lean toward their sustenance to be straightforward and well made which is the highest percentage. Less individuals are believed to concentrate on flavors and included flavors as they take them undesirable and put them ideal at last in the rundown.
Q8:
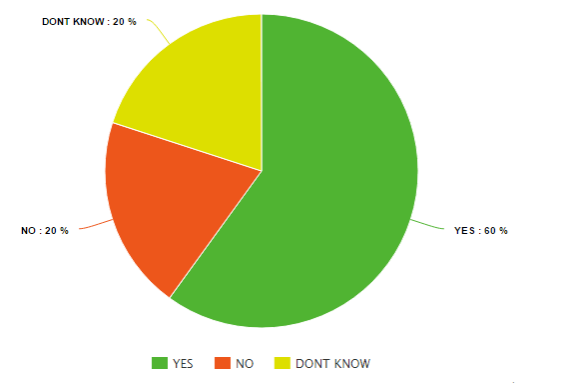
It is clear from the outline that 60% i.e. 33 respondents additionally consider area while going to an Restaurant. A few territories are occupied and eateries and restaurants are existing with impromptu seating structure that puts the guests in a bad position. Thus the majority of the clients lean toward those zones that are less occupied or have enough seating arrangement. 20% of the respondents did not know whether they lean toward location while selecting a restaurant or not and again 20% said they don’t consider location provided the taste of food and the quality of service is great. The new opening of the restaurant accordingly can be considered in the bustling zone yet in that circumstance the venture arranging ought to be done in such away that more thought is given to the seating arrangement as this would put a terrible impact on the guests and may make it troublesome for client maintenance if seats are not available for the customers and they have to stand and wait in the queue.
ANALYSIS:
With the end goal of gathering information through quantitative nature of questionnaire, youngsters with the age of 15-45 and wage levels of chosen respondents from the £6000 every month has been resolved for the examination extend at the places in Central London and different other famous restaurants including Heston Blumenthal, Bread kitchen and Barbeoa (Entrepreneur, 2015). Moreover in this information gathering process, we have considered two noteworthy factors additionally which incorporates Age and Income before tolerating the information. The gathered information would be gotten by means of non-probability sampling. The web based examining will be non-probability testing. Client interest will be founded on a scale.
Measure of dispersions
|
Age |
Population |
|
0-18 |
18 |
|
19-25 |
42 |
|
26-39 |
24 |
|
40-55 |
11 |
|
Over 55 |
5 |
Mean
Income = 18, 21, 25, 22, 40, 13, 24, 12
The sum of these values = 175
Mean= sum/no. Of values = 175/8 = 21.875
The above series of data indicates that, the selected age group has an income between 16k to 38 k. The chosen age group are most of the times looking for high quality food and at the same time look for cheaper and competitive price as well. Therefore, the price of the food in the menu must be lowered so that higher profits are gained.
Measure of dispersion
Standard deviations
|
Differences |
SD |
SD2 |
|
18-21.875 |
-3.875 |
15.01 |
|
21-21.875 |
-0.875 |
0.765 |
|
25-21.875 |
3.125 |
9.76 |
|
22-21.875 |
0.125 |
0.0156 |
|
40-21.875 |
18.125 |
328.51 |
|
13-21.875 |
-8.875 |
78.76 |
|
24-21.875 |
2.125 |
4.51 |
|
12-21.875 |
-9.875 |
97.51 |
Sum of SD2 = 534.8406
Variance = sum of SD2/ n-1 = 534.8406/7
Variance = 76.40
Measure of dispersion = SquareROOT of Variance
Measure of Dispersion = /76.40 = 8.74
Analysis of percentile, quartile and the correlation coefficient
|
Income Y |
Price £,X |
Price*Income |
SD |
|
15000 |
128 |
1920000 |
1920000 |
|
20000 |
135 |
2700000 |
2700000 |
|
21000 |
148 |
3108000 |
3108000 |
|
25000 |
168 |
4200000 |
4200000 |
|
36000 |
179 |
6444000 |
6444000 |
|
40000 |
205 |
8200000 |
8200000 |
|
42000 |
332 |
13944000 |
13944000 |
|
44000 |
523 |
23012000 |
23012000 |
|
48000 |
928 |
44544000 |
44544000 |
|
50000 |
1028 |
51400000 |
51400000 |
|
mean |
15947200 |
18116979.57 |
|
|
quartile |
|||
|
1st Quartile |
22000 |
||
|
Median |
percentile |
38000 |
43000 |
|
3rd Quarter |
percentile |
43500 |
|
|
maxvalue |
percentile |
50000 |
It is particularly obvious from the above table that, quartile estimation of the association proposes that the quartile esteem is in the correct side and the request of the eateries and the value that is offered to the respondents by the eateries separates the information into two equivalent parts. The lower quartile speaks to the information that lies amidst the main set and soon thereafter the 255 of qualities information is nearly littler than the Q1 which is evaluated to be bigger than 75%. Inside the quartile scope of the association unmistakably costs are given optional significance relatively high caliber of sustenance by eateries and additionally pay aggregate individuals. The majority of the wage gatherings are supportive of fantastic nourishment and the interest for this sustenance is less versatile to value (Statista, 2015). Moreover, a few information proposes that expanding level of discretionary cashflow makes the purchaser interest for high caliber of nourishment. The sustenance and taste inclinations are exceptionally subject to the age and salary of the people.
Now, it is suggested in view of the examination that the majority of the clients are leaning toward high caliber of food however that high caliber depends on their livelihoods as well. Distinctive individuals are seen to have diverse large amounts of value food in view of their pay, hence the organization ought not depend on value skimming rather it ought to set a reasonable cost for its high caliber of nourishment that would similarly draw in all the pay gatherings and age bunches. Besides, appropriate measure of publicizing and advertising with quality food and right sort of approach towards the clients can profit the organization over the long haul (Ferraro, 2007). To get high advantages as far as benefit, cost administration methodology can likewise be utilized where the cost is limited and more clients are pulled in to accomplish development.
BUSINESS REPORT:
INTRODUCTION:
In this examination, a total review has been directed with a specific end goal to comprehend clients’ inclinations while going to the restaurants regarding their taste, quality, area and costs. This exploration would help the organization to open another branch in a bustling range of London. Investigate information has been gathered through essential and optional accumulation techniques. This additionally incorporate a questionnaire that has been appropriated among the clients and the managers of various eateries and their responses are displayed as charts and tables.
ANALYSIS:
Restaurant customers in London are less Price sensitive but more touchy to the quality and service. English traditional food sustenance is given inclination over American food thus, menu ought to have assortment in British, Chinese and Indian cuisines as it were. Add up to populace of London is 4.3 million and very nearly 70% of the inhabitants are from various cultural foundations. In this manner, considering diverse social background; taste, flavor, and mood turns out to be essential for an restaurant to settle on before setting up.
Over 60% of the populace likewise considers area in London. Being in occupied zone implies greater duty, higher weight to keep up quality and taste. One can look for more noteworthy overall revenues as value affectability is less because of high salaries in London.
RECOMMENDATIONS:
Blackfriars restaurant has been offering its service to its clients for quite a while. It has now chosen to open a new branch in London. As per the exploration and research information, the main considerations they ought to consider to use sound judgment while opening the second branch and setting up the design include taste, quality and ambience. These elements would help them develop rapidly as well as add incredible distinction to their benefits. Give unique thought to the nature of food and taste instead of Price as Londoners in view of research are less delicate to cost than to the quality. Food ought to be kept Simple and plain. Better seating plans to suit great number of clients ought to likewise be kept in core interest. English, Indian and Chinese food ought to be given extraordinary thought in the menu. Location matters a considerable measure as occupied territories additionally make stopping issues, seating issues, bring down nourishment quality, thusly, these variables ought not be bargained if a bustling zone in London is chosen.
CONCLUSION:
Arranging menu is the foundation of an restaurant business where there is high rivalry of taste, flavor and assortment of foods advertised. In this day and age, an eatery/restaurant business can be effective just if the quality is not bargained. The adequacy and achievement of the eatery is chosen by the stylistic theme and climate of the eatery. Along these lines, extraordinary thought should be given to these zone.
BUSINESS PLAN:
When we discuss setting up an Restaurant business, we need to do different possibility thinks about from various arrangements of information accessible to do arranging and to set up a venture. In this attainability examine we likewise complete research on market we additionally consider money related requirements that can block the venture. With the assistance of essential and auxiliary research it has been examined that the greater part of the client in London are pulled in towards the nature of the nourishment while they are less thoughtful about the cost of the sustenance because of high wage levels. Notwithstanding that, vibe of the eatery and cost in the menu likewise matters a ton can be viewed as one of the central point of a benefit in an eatery business.
Critical Path Analysis:
The following table illustrates those activities that are needed to be undertaken in order to enter Restaurant business market.


