Optical and Surface Studies of α-Al2O3 Powders
| ✅ Paper Type: Free Essay | ✅ Subject: Physics |
| ✅ Wordcount: 2313 words | ✅ Published: 12 Mar 2018 |
X-Ray Diffraction, Optical and surface studies of α-Al2O3 powders synthesized via single step solution combustion method
ABSTRACT
α-Al2O3 powders were synthesized at 500 â°C via solution combustion synthesis (SCS) technique using urea as an organic fuel. The sample was characterized by X- ray diffraction (XRD), Optical spectroscopy and X-ray photoelectron spectroscopy (XPS) without any further thermal treatment. XRD study reveals that sample crystallized directly in the hexagonal α-Al2O3 phase from combustion reaction. Average crystallite size of 37.6 nm was calculated using Debye-Scherrer’s formula. A band gap of 5.68 eV was estimated using diffuse reflectance spectra. Under various UV excitations (260 nm and 400 nm), the sample exhibits a strong emission peak at 693 nm. For surface investigation X-ray photo electron spectroscopy of sample was carried out. XPS survey scan of α-Al2O3 reveals that no other impurity phases were present in the as synthesized sample which supports the results obtained from XRD. Further to understand the chemical states of Al and O, core level spectra of Al-2s and O-1s were studied.
- INTRODUCTION
Among all the known crystallographic phases of alumina, α-Al2O3 is the only stable phase. It represents a ceramic material with a large number of technological importances. This is mainly due to its versatile properties, such as: high melting point, thermal shock resistance, excellent mechanical strength at room temperature and high temperature, large band-gap, hardness and abrasion resistance, chemical inertness [1]. These extra ordinary properties are responsible for α-Al2O3 to be used in various applications such as spark-plugs, ballistic armours [2], abrasives, bioceramics [3], cutting tools [4], electronic components and substrates [5], thermo luminescent dosimeters [6], refractory materials, composite materials [7]. Moreover the compounds and composites of α-Al2O3 also have wide range of applications in various industrial areas such as high-density ceramics [8, 9], biocompatible ceramics [10], and thermal barrier coatings with low thermal conductivities [11, 12]. The high temperature-resistant of Al2O3 coatings have various applications in space and energy production technologies [13]. Since 1961 polycrystalline transparent alumina (Al2O3) has found various optical applications [14]. Single phase α-Al2O3 nanopowders are also important component for solid state fabrication of yttrium aluminum garnet (YAG) transparent laser ceramics [15, 16].
There are several techniques used for the synthesis of α-Al2O3. In literature there are reports available for the synthesis of single-phase α-Al2O3 powders using urea [1, 17–19], carbohydrazide [20] or hydrazine [21] as fuels, without any further heat treatments. Several authors have reported two step method for the synthesis of α-Al2O3 such as reverse micelle [22], sol–gel processing [23], flame spray pyrolysis [24] which require calcinations at 1000–1100 â°C to obtain completely phase pure α-Al2O3.

In the present paper, we report the optical and surface properties of as synthesized α-Al2O3 powder by the low temperature solution combustion synthesis (SCS) technique. Urea was used as an organic fuel for combustion because it has proven to be the best fuel for combustion of aluminum nitrate [1, 17].
- EXPERIMENTAL
α-Al2O3 powders were synthesized by low temperature solution combustion synthesis (SCS) using urea as a fuel. The starting materials for the synthesis of α-Al2O3 were high-purity aluminum nitrate nonahydrate [Al (NO3)3.9H2O] and urea (H2NCONH2) from Merck Chemicals, India. The reagents were weighed according to the chemical reaction given in equation (1) in the molar stoichiometric ratio of 2:5. The oxidizer to fuel ratio was calculated using the oxidizing and reducing vacancies of reactants in equation (1). For a complete combustion reaction the ratio of oxidizer ( ) and fuel (
 ) should be unity, because at this ratio maximum heat is produced.

The weighed reactants were mixed in agate mortar by adding few drops of deionized water at room temperature till the solution transform into a transparent viscous gel. The gel was transferred to a Borosil beaker and then introduced to a preheated muffle furnace around 500 â°C. The gel undergoes rapid dehydration with evolution of large amount of gasses and burns with an incandescent flame yielding voluminous white product. The whole combustion process was completed within 2-3 minutes. The beaker was then taken out and the resultant product was grounded into a fine powder and was characterized without any further treatment. The crystalline structure and particle morphology of the combusted powders were investigated using a standard diffractometer (Bruker D8 Advance) in the θ –2θ geometry with scanning step of 0.02â° and Cu Kα radiation (λ=1.5406 Å). Diffused reflectance spectrum was recorded using ISR assembly attached with Shimadzu UV-2600 Double beam spectrophotometer in the region 190-1400 nm. The spectral features like photoluminescence excitation and emission (in phosphorescence mode) spectra were measured using a Cary-Eclipse spectrofluorometer (Shimadzu) equipped with a Xenon lamp used as an excitation source. The X-ray photoelectron spectroscopy (XPS) measurement was performed using Omicron energy analyzer (EA-125) with Al Kα (1486.6 eV) X-ray source. The background vacuum in the analyzer chamber was of the order of 10-10 Torr during the XPS measurement. All these characterization were carried out at room temperature.
- RESULTS AND DISCUSSION
3.1 XRD
The crystal structure and phase purity of the as synthesized Al2O3 powders were analyzed using the X-ray diffraction (XRD) technique. Fig.1. shows the XRD patterns of as synthesized Al2O3 powders recorded in a wide range of Bragg angle 2θ (20° ≤ 2θ ≤ 90°). All the observed diffraction peaks can be indexed with the hexagonal phase of bulk α-Al2O3 referenced in the JCPD’s file no. 71-1123 with space group R . No other impurity peaks were observed in the as synthesized powder neglecting the presence of any other phase other than α-Al2O3. These XRD patterns were in good agreement with the earlier published reports by Robert Ianos et al. [1] and Laishram et al. [17] for the α-Al2O3 phase. The lattice parameter calculated from XRD pattern were (a = b= 4.755 Å, c =12.985 Å) which were very close when compared with the unit cell of α-Al2O3 (a = b= 4.761 Å, c =12.99 Å, JCPDs file No. 71-1123).
The crystallite size was calculated using Debye-Scherer formula [25]

where D is the crystallite diameter, λ is the wavelength of x-ray source used (Cu Kα = 0.1506 nm),  is the full width at half maxima (FWHM) of an individual peak at 2θ (where θ is the Bragg angle) and
  is characteristic of the instrument broadening.

Fig.1. XRD pattern of as synthesized α-Al2O3 powders at 500 â°C along with the stick patterns for the JCPDS file no. 71-1123
Three most intense peaks were selected for the calculation of particle size and calculated particle size for α-Al2O3 was 37.6 nm.
3.2 Spectral Study
Fig. 2 shows the diffuse reflectance and the absorption spectra of α-Al2O3. Barium sulfate (BaSO4) compound was used as a reference standard during the measurement. In both spectra a sharp band around 220 nm is observed which corresponds that light having this particular wavelength was absorbed.

Fig.2. The diffuse reflectance and absorption spectra of the α-Al2O3 powders.
Calculation of bandgap.
Kubelka–Munk (K–M) [26] theory was used for the calculation of bandgap of α-Al2O3 powders using diffused reflectance (DR) spectrum. In a DR spectrum, the ratio of the light scattered from a thick layer of sample and an ideal non-absorbing reference sample is measured as a function of the wavelength λ,  [26, 27]. The relation between the DR of the sample
 , scattering coefficient (S) and absorption coefficient (K) is given by

where  is the Kubelka–Munk or remission function.
The linear absorption coefficient α and the band gap  of a material is related through the well-known relation known as Tauc relation [28]:
 3
3
where hν is the photon energy and C1 is a constant of proportionality. When incident light is illuminated at 60â°, the material scatters perfectly in a diffuse manner then absorption coefficient K becomes equal to 2α i.e.  . Considering the K-M scattering coefficient S as constant with respect to wavelength, and using equations (2) and (3), the following expression can be written:
 4
4
Obtaining the value of  from Eq. 2 and plotting
  versus
 , the value of
  is obtained by extrapolating the linear fitted regions to
Figure 3 shows the square of the optical absorption times the photon energy as a function of photon energy for α-Al2O3 powders. In the present case (α-Al2O3), the band gap was estimated around 5.68 eV. Aguilar et al. [29] calculated an optical energy band gap of 5.63 eV for Al2O3 films deposited on quartz substrate.

Fig.3. Energy bandgap calculation of α-Al2O3 using K-M functions.
Photoluminescence
Fig. 4 (a) shows the photoluminescence excitation (PLE) spectra of α-Al2O3 recorded at an emission wavelength of 695 nm, the excitation spectra consists of a broad band centered at 400 nm. Fig. 4 (b) shows the PL emission spectra of α-Al2O3 monitored at excitation wavelengths of 260 nm and 400 nm respectively. An intense peak at 693 nm is observed. Similar results were also observed by Kaplyanskiiet al. [30] and Nagabhushana et al. [31] for α-Al2O3. Kaplyanskiiet al. [30] suggest that this emission peak may be due to crystal lattice belonging to the α phase of Al2O3.

Fig.4. Photoluminescence spectra of as synthesized α-Al2O3 (a) excitation recorded at λemm = 695 nm and (b) emission recorded at λext = 260 nm and 400 nm.
3.3 Surface Studies
In material science, X-ray photoelectron spectroscopy (XPS) has proved to be a powerful analytical technique that can be used to study the elemental composition and the oxidation states.
Figure 5 shows the X-ray photoelectron spectroscopy (XPS) survey scan of the α-Al2O3 powders. The XPS survey scan of the α-Al2O3 indicates that only Al, O and C are present in the sample corresponding to their binding energies. Carbon was the only impurity present in the sample which was expected. The positions of various photoemission peaks are marked in the survey scan corresponding to the elements present in the as synthesized sample. To further understand the chemical states of Al and O ions in α-Al2O3 powder we have further performed the detailed scan for O-1s and Al-2s core spectra. The value corresponding to C 1s peak (284.6 eV) was used as a reference for spectrum analysis.

Fig.5. Survey Scan of as synthesized α-Al2O3 powder.
Figure 6 shows the XPS detailed scan for the O-1s core level. The raw data was fitted with combined Gausssian – Lorentzian functions. The fitted peak shows only one prominent peak which is centered at 529.70 eV and is attributed to the Al-O bonding in the α-Al2O3 structure. Figure 7 shows the narrow scan for the Al 2s core level. Only one peak is observed after fitting which is centered at 118.95 eV. These narrow scan spectra of O-1s and Al-2s shows that all the O2- ions are bonded to Al3+ ions in the sample. Thus the chemical state of Oxygen and Aluminum is -2 and+3 respectively in the lattice. Rotole et al. [32] observed O-1s peak at 530.68 eV and Al-2s peak at 118.93 eV for standard α-Al2O3. The difference in the binding energies may be due to the highly insulating nature of the sample.
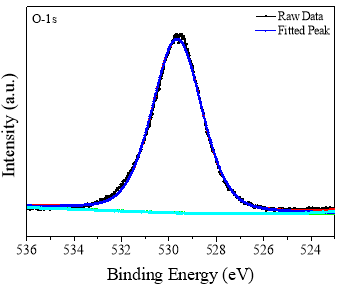
Fig. 6 XPS core level spectra of O 1s in α-Al2O3 powder.

Fig. 7 XPS core level spectra of Al 2s in α-Al2O3 powder.
- Conclusion
In summary, the α-Al2O3 powders were successfully prepared by low temperature solution combustion method with metal nitrate reactants and urea as organic fuel. The XRD results confirm that hexagonal phase of α-Al2O3 could be obtained directly by combustion method at 500 â°C without any further treatment. The band gap of sample was calculated using diffused reflectance spectra and it was found estimated 5.68 eV. Under UV excitations, the powders exhibit a strong emission peak around 693 nm. XPS results show that as synthesized powders were free from impurities. The core level spectra of Al-2s and O-1s reveals that chemical state of Al and O is +3 and +2 respectively in α-Al2O3.
ACKNOWLEDGMENTS
The authors humbly acknowledged Director, UGC-DAE CSR Indore for providing experimental facility. The authors are thankful to Dr. M. Gupta for XRD measurements. The authors are grateful to Mr. A. Wadikar for helping in XPS measurements.
REFRENCES
- R. Ianos¸ I. Lazau and C. Pacurariu, J. Mater. Sci. 44, 1016 (2009).
- A.Y. Badmos and D.G. Ivey, J. Mater. Sci. 36, 4995 (2001).
- D. Gitknecht, J. Chevalier, V. Garnier and G. Fantozzi, J. Eur. Ceram. Soc. 27, 1547 (2007).
- E. Volceanov, A. Volceanov and S. Stoleriu, J. Eur. Ceram. Soc. 27, 759 (2007).
- S. Menecier, J. Jarrige, J.C. Labbe and P.L. Lefort, J. Eur. Ceram. Soc. 27, 851 (2007).
- V.S. Kiiko, Y.N. Makurin, A.A. Safronov, A.N. Enyashin and A.L. Ivanovskii, Refract. Ind. Ceram. 44, 94 (2003).
- T.M. Ul’yanova, L.V. Titova and N.P. Krut’ko Glass. Ceram. 59, 279 (2002).
- G.R. Karagedov and N.Z. Lyakhov, Nanostruct. Mater. 11, 559 (1999).
- J. Chandradass, K. H. Kim, D. S. Bae, K. Prasad, G. Balachandar, S.A.S. Divya and M. Balasubramanian, J. Eur. Ceram. Soc. 29, 2219 (2009).
- L. G. Gutwein and T. J. Websterles, Biomaterials 25, 4175 (2004).
- G. Muer and R. Vaben, Surface Engineering 27, 477 (2011).
- T. Hejwowski, Vacuum 85, 610 (2010).
- N.P. Padture, M. Gell and E.H. Jordan, Science 296, 280 (2002).
- R.L. Coble, Transparent alumina and method of preparation. US Patent 3,026,210, January 3 (1961).
- S. H. Lee, S. Kochawattana, G. L. Messing, J. Q. Dumm, G. Quarles and V. Castillo, J. Am. Ceram. Soc. 89, 1945 (2006).
- J. Li, Y. Wu, Y. Pan, W. Liu, L. An, S. Wang and J. Guo, Front. Chem. Eng. China 2, 248 (2008).
- K. Laishram, R. Mann and N. Malhan, Ceramic International 38, 1703 (2012).
- T. Mimani, Resonance 5, 50 (2000).
- T. Mimani and K.C. Patil, Mater. Phys. Mech. 4, 134 (2001).
- C. C. Chen and K.T. Huang, J. Mater. Res. 20, 424 (2005).
- O. Ozuna, G.A. Hirata and J. McKittrick, J. Phys. Condens. Matter 16, 2585 (2004).
- J. Chandradass and D.S. Bae, Mater. Manuf. Proc. 23, 494 (2008).
- F. Mirjalili, M. Hasmaliza and L. Chuah Abdullah, Ceram. Int. 36, 1253 (2010).
- A.I.Y. Tok, F.Y.C. Boey and X.L. Zhao, J. Mater. Proc. Technol. 178, 270 (2006).
- B.D. Cullity, Element of X-ray Diffraction, second ed., Addison-Wesley, MA (1972).
- A. E. Morales, E. S. Mora and U. Pal Rev. Mex. Fis S 53, 18 (2007).
- S. Som and S.K.Sharma, J. Phys. D: Appl. Phys. 45, 415102 (2012).
- R.A. Smith, Semiconductors, 2nd ed. Cambridge University Press: Cambridge, (1978).
- M. A. Frutis, M. Garcia and C. Falcony, Appl. Phys. Lett. 72, 1700 (1998).
- A. A. Kaplyanskii, A. B. Kulinkin, A. B. Kutsenko, S. P. Feofilov, R. I. Zakharchenya and T. N. Vasilevskaya, Phys. Solid State 40, 1310 (1998).
- K. R. Nagabhushana, B. N. Lakshminarasappa and Fouran Singh, Bull. Mater. Sci. 32, 515 (2009).
- John A. Rotole and Peter M.A. Sherwood , Surface Science Spectra 5, 11 (1998).
Cite This Work
To export a reference to this article please select a referencing stye below:
Related Services
View all


DMCA / Removal Request
If you are the original writer of this essay and no longer wish to have your work published on UKEssays.com then please click the following link to email our support team:
Request essay removal