The Process and Characteristics of Research
| ✅ Paper Type: Free Essay | ✅ Subject: Psychology |
| ✅ Wordcount: 2817 words | ✅ Published: 11 Sep 2017 |
Research is the process of arriving at a solution to a problem through the planned and systematic collection, analysis and interpretation of data (Crano, Brewer, & Lac, 2014). Research based on the scientific method is when; a problem is identified, relevant data is collected, a hypothesis is formed from the data, and the hypothesis is tested (Coolican, 2014, p. 10; Wolfs, 1996). To further expand on this definition are several steps to the research process as shown in Figure 1.
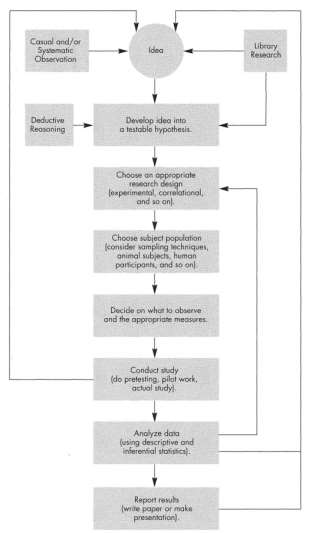
Figure 1. The research process(Bordens & Abbott, 2014, p. 27)
The article (Figure 2) clearly states that the forecast was part of the Vital Signs 2016 report (Momentum Waikato Community Foundation, 2016). Even though there is little stated in the article in regards to the research process, this has been implied by stating that the information came from the Vital Signs report and that information was gathered through public input/feedback and statistics.
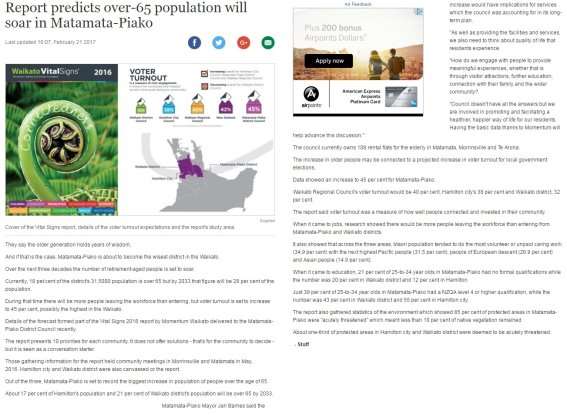
Figure 2. Research Article (Stuff, 2017)
The Vital Signs report (Momentum Waikato Community Foundation, 2016) demonstrates the research process as outlined in Figure 1. The idea or reason for the report according to the article was to define priorities for the Waikato regions. The research design was of a mixed method. The quantitative data was gathered from secondary data sources such as; Statistics New Zealand and the NZ Health Survey, with the qualitative methods being obtained through public events and iwi and youth engagement sessions. The subject population being Hamilton city and the Waikato and Matamata-Piako regions, with over 400 residents of the regions, as well as iwi and youth being involved.

The qualitative information was gathered from four public events and engagement sessions, which focused on finding what the priorities, views and feedback were from the regions participants. Other data concerning the quantitative measures was obtained from; census data 2006/13/15, Statistics New Zealand; 2013/14 Active New Zealand Survey, Sport New Zealand; 2011-14, NZ Health Survey; 2015 Workforce Survey and The Royal New Zealand College of General Practitioners. All the data was collated and analysed by the National Institute of Demographic and Economic Analysis (NIDEA) for the purposes of the Vital Signs 2016 report. The results of this report were reported in the article.
Credibility of the Forecast
To determine the credibility of the forecast, the forecaster and the research referenced, one needs to further investigate the authority; relying on what those in positions of authority say, accuracy; whether the source is accurate, objectivity; whether the source shows bias and, currency; whether the source is up to date.
The article directly states the source of the information as being the Vital Signs Report (Momentum Waikato Community Foundation, 2016). This offers two sources to look at determining the credibility of the research. It is important to show the research design with the results, so that the credibility of the study can be determined (Neuman, 2009). The Vital Signs methodology, created in 2001, has more than 75 communities around the world using Vital Signs. The Waikato Vital Signs is led by Momentum Waikato Community Foundation in partnership with six major Waikato philanthropic trusts: NAR Foundation; Trust Waikato; WEL Energy Trust; Waikato-Tainui; D.V. Bryant Trust and Ngati Haua Iwi Trust, along with the National Institute of Demographic and Economic Analysis (NIDEA), University of Waikato.
The data quoted in the article were sourced from the Vital Signs 2016 report to provide an insight between statistical information and what matters most to people living in the Waikato and Matamata-Piako regions. This was achieved with the support of the Vital Signs Reports’ philanthropic partners; D.V. Bryant Trust, Momentum Waikato Community Foundation, NAR Foundation, Ngati Haua Iwi Trust, Trust Waikato, Waikato Tainui and WEL Trust.
“Validity is one of the strengths of qualitative research and is based on determining whether the findings are accurate from the standpoint of the researcher, the participant, or the readers of an account” (Creswell & Miller, 2000). NIDEA collated and analysed existing qualitative data from the secondary data source as mentioned previously. The quantitative data within the report was formed from a variety of public events and engagement sessions involving Waikato residents, local iwi and youth to help form an overall view of the regions priorities and visions.
By looking at the Vital Signs concept, the philanthropic partners, the involvement of NIDEA for collating and analysing data, the quantitative data sourced and the method in which the qualitative data was collected, the report appears to hold a strong sense of credibility.
Task 2: Non-Research Based Article
Other Ways of Knowing
Other ways of knowing can include such things such as; intuition; based on preconscious ideas, authority; based on what authorities say, rationalism; based on reasoning and empiricism; based on experience (Christensen, Johnson, & Turner, 2013).
The articles (Figure 3) headline; ‘Safety advocate predicts more deaths if speed limit raised’, is further supported by views within the article that increasing the speed limit could “…lead to more deaths and injuries” (Brake, 2017, as cited in Radio New Zealand, 2016). With such campaigns as ‘speed kills’ being part of everyday life since the 70’s, it is deduced that these prior beliefs and assumptions may allow us to accept this reasoning; that speed does in fact cause deaths. This reasoning is a form of syllogism; when a conclusion is made from two premises (Singh, 2007, p. 20). In this case the first premise is speeding while driving, the second premise is that if that person crashes and causes a death that the conclusion is made that ‘speed kills’. 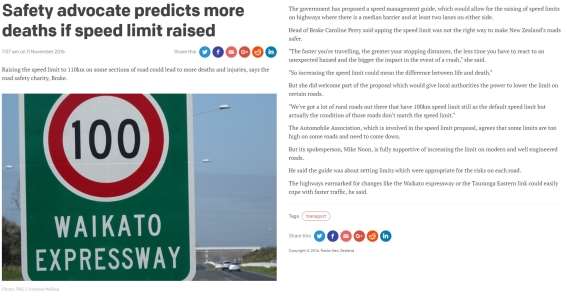
Figure 3. Un-researched Article (Radio New Zealand, 2016)
The Automobile Association (AA) states that they agree that some limits are too high and need to be lowered. The AA in this article is clearly being used as an authority figure; that is an individual/organisation who is viewed as being respected and knowledgeable in their field, whether this is supported or not (Bordens & Abbott, 2014).
Credibility of the Forecast
To determine credibility of the forecast and/or forecaster it is important to look at their expertise, their credentials, whether there is bias and whether the predictions they make are verifiable and accurate (Bordens & Abbott, 2014). The forecaster in the article is the road safety charity, Brake (Brake, the road safety charity, 2017). According to their website; “Brake is a national road safety charity that works to prevent road deaths and injuries and support people bereaved and injured in crashes across New Zealand” (2017). From this we can see that there is bias when it comes to the credibility of their predictions, with their charity clearly supporting the emotional viewpoint of victims. To be credible, the source must be objective, as defined by Christensen, Johnson, & Turner (2013, p. 37); objectivity is the “goal in science to eliminate or minimise opinion or bias in the conduct of research”.
The other authority that the article has relied on is the AA, whom have provided funding for research pertaining to road safety through the AA Research Foundation (The New Zealand Automobile Association, 2017), but as shown from their past and ongoing research on their website, speed and road deaths are not one of the one of the fields they have researched. As such, their opinions are non-verifiable.
The overall credibility of the predictions made is clearly not substantiated by any verifiable data, and the opinions made by Brake do not add to the credibility due to their lack of objectivity. The AA does hold a degree of authority, as they have been involved in research pertaining to road safety, but their viewpoints in this article are not backed by any substantiated data or research.
Task 3: Strengths and Limitations
Research using the scientific method provides a way of understanding and predicting phenomena using a logical process that is rational and objective. It is based on empirical evidence and verification. When making the predictions within the article (Figure 2), quantitative data was used and in this case it was secondary data from government statistics, health system metric, etc. This data/ evidence used to verify the statements being made, clearly coming from verifiable sources.
The other evidence/data within the article was of a qualitative nature; gathered from public events and engagement sessions to further expand on the knowledge acquired from the quantitative data and provide insight into the region. Qualitative data can complement and refine quantitative data, but can be difficult to analyse as the findings usually cannot be generalised or easily categorised.
The scientific method is incapable of judgement. It cannot say that a phenomena is good or bad, it can study the causes and effects of a phenomena and can report on those results.
Other ways of knowing we can include; language, reason, sense perception, memory, faith, intuition, imagination and emotion. The predictions within the article (Figure 3) were made from perceived authority figures and although using authority figures can provide strength to back up ones claims, there must be awareness that the source may not be truly authoritative. As one example using the AA as an authorities source; even though they had done research on road safety, they have not specifically researched speed as a factor for road deaths, which questions the validity of their statements.
The other way of knowing used within the article was deduced from previous beliefs and assumptions that ‘speed kills’. This is a well-known phrase to all of us; it is what can be perceived as learned knowledge. In the article this is used to reiterate the predictions that increasing the speed limit could “lead to more deaths and injuries” (Brake, 2017, as cited in Radio New Zealand, 2016). The reasoning behind their forecast is that it is because of speed that road deaths do and will occur, yet they fail to take into other factors such as road conditions, fatigue, etc., without empirical evidence to support such predictions.
Using other ways of knowing to put forth predictions, is not based on empirical evidence, but this does not mean that it is not without its merits. The ideas that are put forth can help; form a relationship between variables, learn more about the phenomenon and, initiate further research. In short these other ways of knowing are the ideas on which to build a hypothesis as stated by Bordens and Abbott (2014), “… these ideas must then be subjected to rigorous scientific scrutiny rather than being accepted at face value” (p. 23).
References
Bordens, K. S., & Abbott, B. B. (2014). Research design and methods: A process approach (9th ed.). New York: McGraw-Hill.
Brake. (2017). Brake, the road safety charity. Retrieved February 21, 2017, from Brake: http://www.brake.org.nz/
Christensen, L. B., Johnson, R. B., & Turner, L. A. (2013). Research Methods, Design, and Analysis (12th ed.). England: Pearson Education.
Coolican, H. (2014). Research Methods and Statistics in Psychology (6th ed.). New York: Psychology Press.
Crano, W. D., Brewer, M. B., & Lac, A. (2014). Principles and methods of social research (3rd ed.). New York: Routledge.
Creswell, J. W., & Miller, D. (2000). Determining validity in qualitative inquiry. Theory Into Practice, 39(3), 124-130.
Momentum Waikato Community Foundation. (2016). Waikato Vital Signs Report 2016. Retrieved 03 01, 2017, from Momentum Waikato: https://static1.squarespace.com/static/556f46bce4b02b07d0842cc7/t/5800196fb8a79b850d84e805/1476401672824/Waikato_Vital_Signs_Report_2016_lowres.pdf
Neuman, W. L. (2009). Social research methods: Qualitative and quantitative approaches (7th ed.). Boston: Allyn & Bacon.
Radio New Zealand. (2016). Safety advocate predicts more deaths if speed limit raised. Retrieved February 21, 2017, from Radio New Zealand: http://www.radionz.co.nz/news/national/317842/safety-advocate-predicts-more-deaths-if-speed-limit-raised
Singh, Y. K. (2007). Research Methodology. New Delhi: APH Publishing Corporation.
Stuff. (2017). Report predicts over-65 population will soar in Matamata-Piako. Retrieved February 21, 2017, from Stuff: http://www.stuff.co.nz/waikato-times/news/matamata-chronicle/89433039/report-predicts-over65-population-will-soar-in-matamatapiako
The New Zealand Automobile Association. (2017). AA Research Foundation. Retrieved February 21, 2017, from The New Zealand Automobile Association: http://www.aa.co.nz/about/aa-research-foundation/programmes/
Wolfs, F. (1996). Appendix E: Introduction to the Scientific Method. 1-6. Rochester: University of Rochester. Retrieved February 21 , 2017, from http://teacher.nsrl.rochester.edu/phy_labs/AppendixE/AppendixE.html
Appendix A
Researched based article
Report predicts over-65 population will soar in Matamata-Piako
They say the older generation holds years of wisdom.
And if that is the case, Matamata-Piako is about to become the wisest district in the Waikato.
Over the next three decades the number of retirement-aged people is set to soar.
Currently, 18 per cent of the district’s 31, 5000 population is over 65 but by 2033 that figure will be 28 per cent of the population.
During that time there will be more people leaving the workforce than entering, but voter turnout is set to increase to 45 per cent, possibly the highest in the Waikato.
Details of the forecast formed part of the Vital Signs 2016 report by Momentum Waikato delivered to the Matamata-Piako District Council recently.
The report presents 10 priorities for each community. It does not offer solutions – that’s for the community to decide – but it is seen as a conversation starter.
Those gathering information for the report held community meetings in Morrinsville and Matamata in May, 2016. Hamilton city and Waikato district were also canvassed or the report.
Out of the three, Matamata-Piako is set to record the biggest increase in population of people over the age of 65.
About 17 per cent of Hamilton’s population and 21 per cent of Waikato district’s population will be over 65 by 2033.
Matamata-Piako Mayor Jan Barnes said the increase would have implications for services which the council was accounting for in its long-term plan.
“As well as providing the facilities and services, we also need to think about quality of life that residents experience.
“How do we engage with people to provide meaningful experiences, whether that is through visitor attractions, further education, connection with their family and the wider community?
“Council doesn’t have all the answers but we are involved in promoting and facilitating a healthier, happier way of life for our residents. Having the basic data thanks to Momentum will help advance this discussion.”
The council currently owns 108 rental flats for the elderly in Matamata, Morrinsville and Te Aroha.
The increase in older people may be connected to a projected increase in voter turnout for local government elections.
Data showed an increase to 45 per cent for Matamata-Piako.
Waikato Regional Council’s voter turnout would be 40 per cent, Hamilton city’s 38 per cent and Waikato district, 32 per cent.
The report said voter turnout was a measure of how well people connected and invested in their community.
When it came to jobs, research showed there would be more people leaving the workforce than entering from Matamata-Piako and Waikato districts.
It also showed that across the three areas, Maori population tended to do the most volunteer or unpaid caring work (34.9 per cent) with the next highest Pacific people (31.5 per cent), people of European descent (26.9 per cent) and Asian people (14.9 per cent).
When it came to education, 21 per cent of 25-to-34 year olds in Matamata-Piako had no formal qualifications while the number was 20 per cent in Waikato district and 12 per cent in Hamilton.
Just 39 per cent of 25-to-34 year olds in Matamata-Piako had a NZQA level 4 or higher qualification, while the number was 43 per cent in Waikato district and 55 per cent in Hamilton city.
The report also gathered statistics of the environment which showed 85 per cent of protected areas in Matamata-Piako were “acutely threatened” which meant less than 10 per cent of native vegetation remained.
About one-third of protected areas in Hamilton city and Waikato district were deemed to be acutely threatened.
– Stuff
Retrieved 21 Feb, 2017
Appendix B
Non-researched based article
Safety advocate predicts more deaths if speed limit raised
Raising the speed limit to 110km on some sections of road could lead to more deaths and injuries, says the road safety charity, Brake.
The government has proposed a speed management guide, which would allow for the raising of speed limits on highways where there is a median barrier and at least two lanes on either side.
Head of Brake Caroline Perry said upping the speed limit was not the right way to make New Zealand’s roads safer.
“The faster you’re travelling, the greater your stopping distances, the less time you have to react to an unexpected hazard and the bigger the impact in the event of a crash,” she said.
“So increasing the speed limit could mean the difference between life and death.”
But she did welcome part of the proposal which would give local authorities the power to lower the limit on certain roads.
“We’ve got a lot of rural roads out there that have 100km speed limit still as the default speed limit but actually the condition of those roads don’t match the speed limit.”
The Automobile Association, which is involved in the speed limit proposal, agrees that some limits are too high on some roads and need to come down.
But its spokesperson, Mike Noon, is fully supportive of increasing the limit on modern and well engineered roads.
He said the guide was about setting limits which were appropriate for the risks on each road.
The highways earmarked for changes like the Waikato expressway or the Tauranga Eastern link could easily cope with faster traffic, he said.
-Radio New Zealand
Retrieved 21 Feb, 2017
Cite This Work
To export a reference to this article please select a referencing stye below:
Related Services
View all


DMCA / Removal Request
If you are the original writer of this essay and no longer wish to have your work published on UKEssays.com then please click the following link to email our support team:
Request essay removalRelated Services
Our academic writing and marking services can help you!
Freelance Writing Jobs
Looking for a flexible role?
Do you have a 2:1 degree or higher?
Study Resources
Free resources to assist you with your university studies!